Social Graph
Summary
For this project, we assembled the social graph of social connections of New York’s social elite, and determined most influential people, and the most tightly coupled pairs.
Data format
The photographs from the gathering and events can potentially represent the social connection of New York’s social elite. The data is collected from annotated photo captions that imply the connections between individuals appeared in those photographs.
Data Gathering
Crawl the HTML files to extract ~ 96000 captions from more than 1100 photo pages. Python Requests and BeautifulSoup are used to download and process the HTML.
Parsing captions
The preprocessing step includes parsing names from captions where the following steps were taken:
-
Isolating list of names by eliminating narrative texts, sentences, and commonly repeated words/patterns, using nltk (part-of-speech tagging, Chunking/Chinking, Frequency distribution) and regex
-
Using some heuristic rule with regex to split captions, find and filter out the titles (Mayor, president, etc.), and parse couples name
Assemble the graph
As discussed before, this problem can be resembled by a graph that represents social relations between people where a pair of people appear in a photo together corresponds to a link. An obvious mathematical analog for this systems is an undirected weighted graph. To construct such graph we used networkx library.
Identify social relations
Using the social graph, we can make guesses at the most popular socialites or influential people, and the most tightly coupled pairs.
The most popular individuals are those with highest number of connections (i.e., nodes with biggest degree). Another approach employed to determine popularity is
PageRank, which is used for web ranking. The most tightly coupled pairs (best friends) that tend to coappear with each other are graph edges with highest weight.
from pyvis.network import Network

SG = nx.subgraph(G, top_nodes)
net = Network(notebook=True, height='1000px', width='1000px')
net.from_nx(SG)
net.show('SG.html')
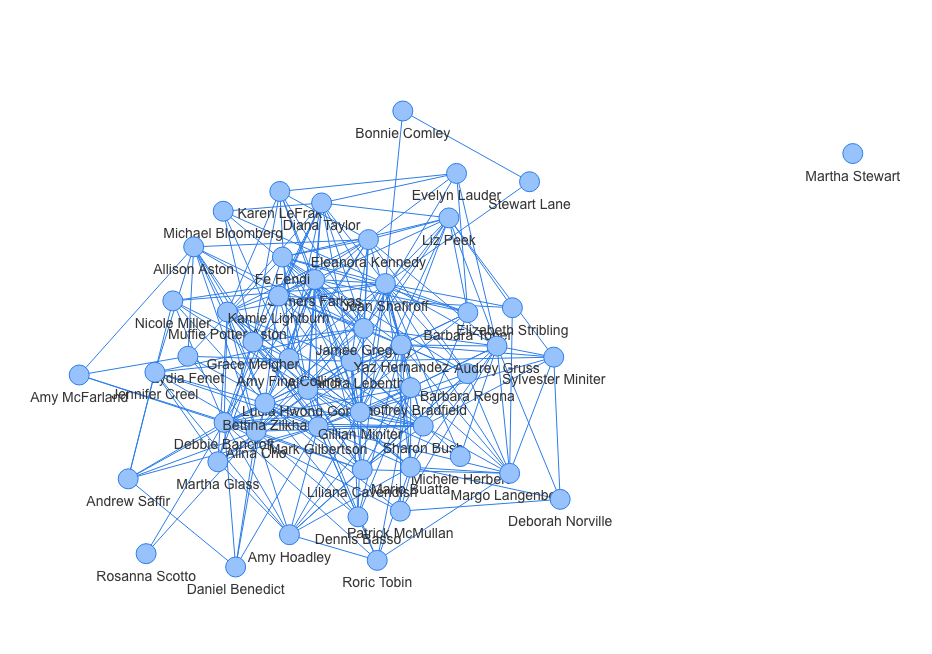
The figure below shows the subgraph of the social graph “G” for top 50 most popular people. can be found by counting the number of connections.